Projects
Four projects built from public data, from the raw files to a working Power BI report, plus dashboards from client work.
Norvalis Airline
Loyalty program analysis in Power BI and Python
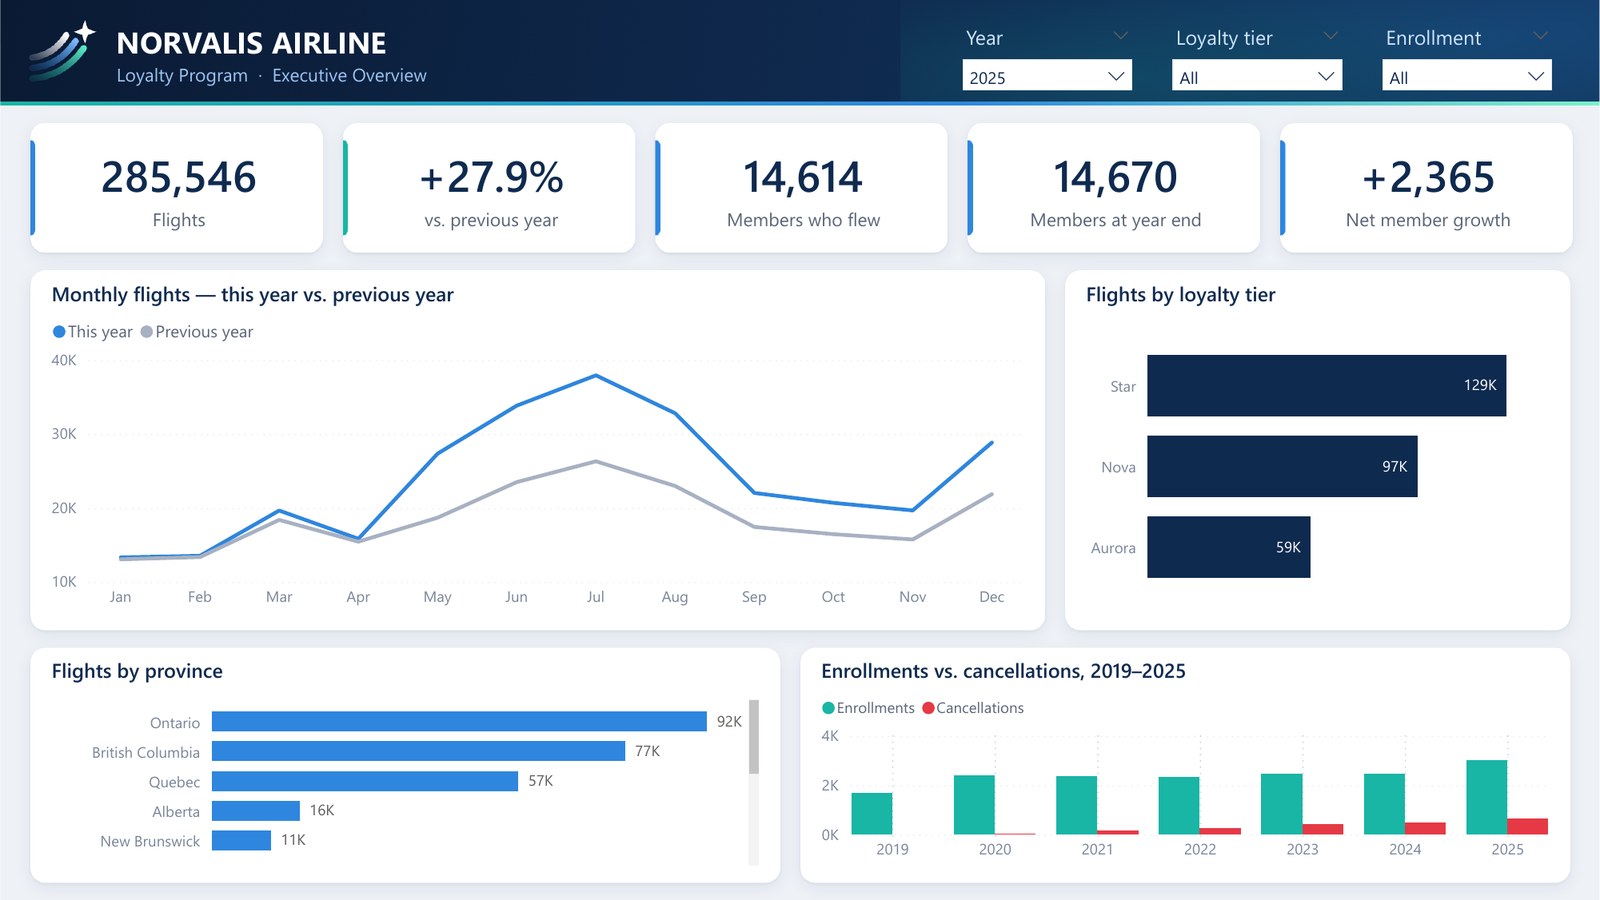
Did the 2025 enrollment campaign create loyal customers, or just a busy summer?
Flights rose 27.9% in 2025, but members who joined before that year flew only 2.3% more. Most of the growth, 72%, came from the 971 people who joined through the campaign.
Campaign members cancelled at 11.8%, against 2.2% for regular joiners, and most of them left exactly eight months in. That tells you when a retention offer should go out. The members who left at month eight took $1.1M of lifetime value with them.
The video shows an AI analyst connected to the Power BI model, answering questions in plain English and building charts the dashboard doesn’t have.
Corvexa Card
Credit-card churn prediction in Power BI and Python
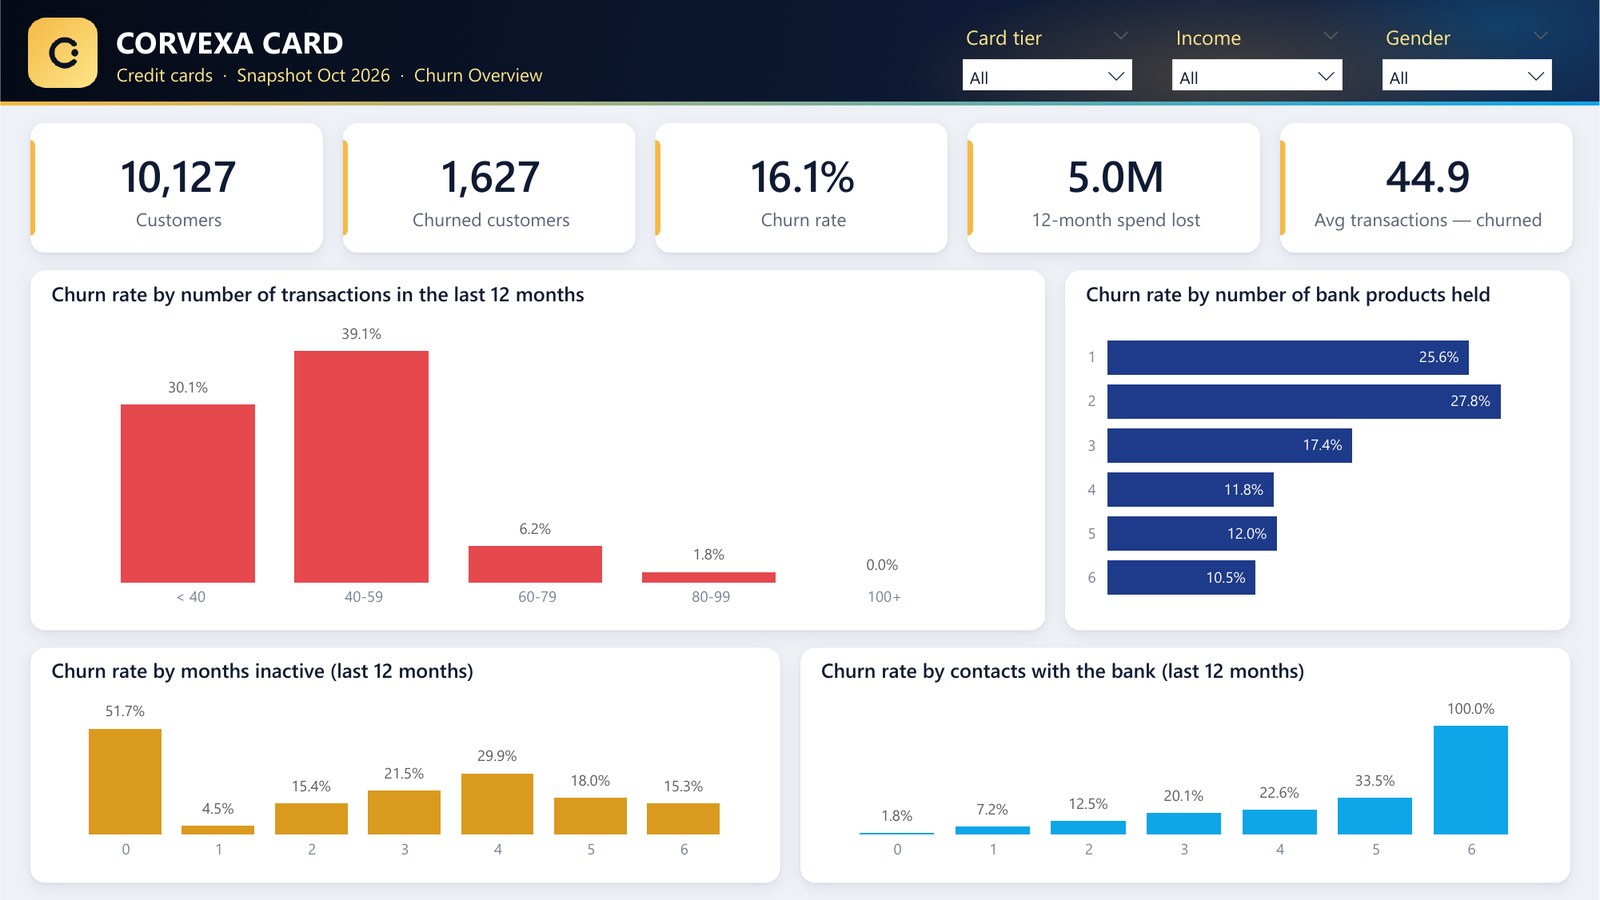
Which active customers are about to leave, why, and what should the retention team do about each one?
A machine-learning model scores every customer, with a cross-validated AUC of 0.99. 204 active customers are on the watch list, 111 of them at high risk, and about 117 are expected to leave if nothing is done.
Pick a customer and a waterfall chart shows what pushes their risk up or down, next to a suggested action such as a cashback offer, a service call or a second product.
A logistic regression with odds ratios and p-values shows which levers matter. Falling card activity is the strongest warning sign, and more contact with the bank and longer inactivity also raise the risk.
Loomvale Home
Online store sales analysis in Power BI and Python
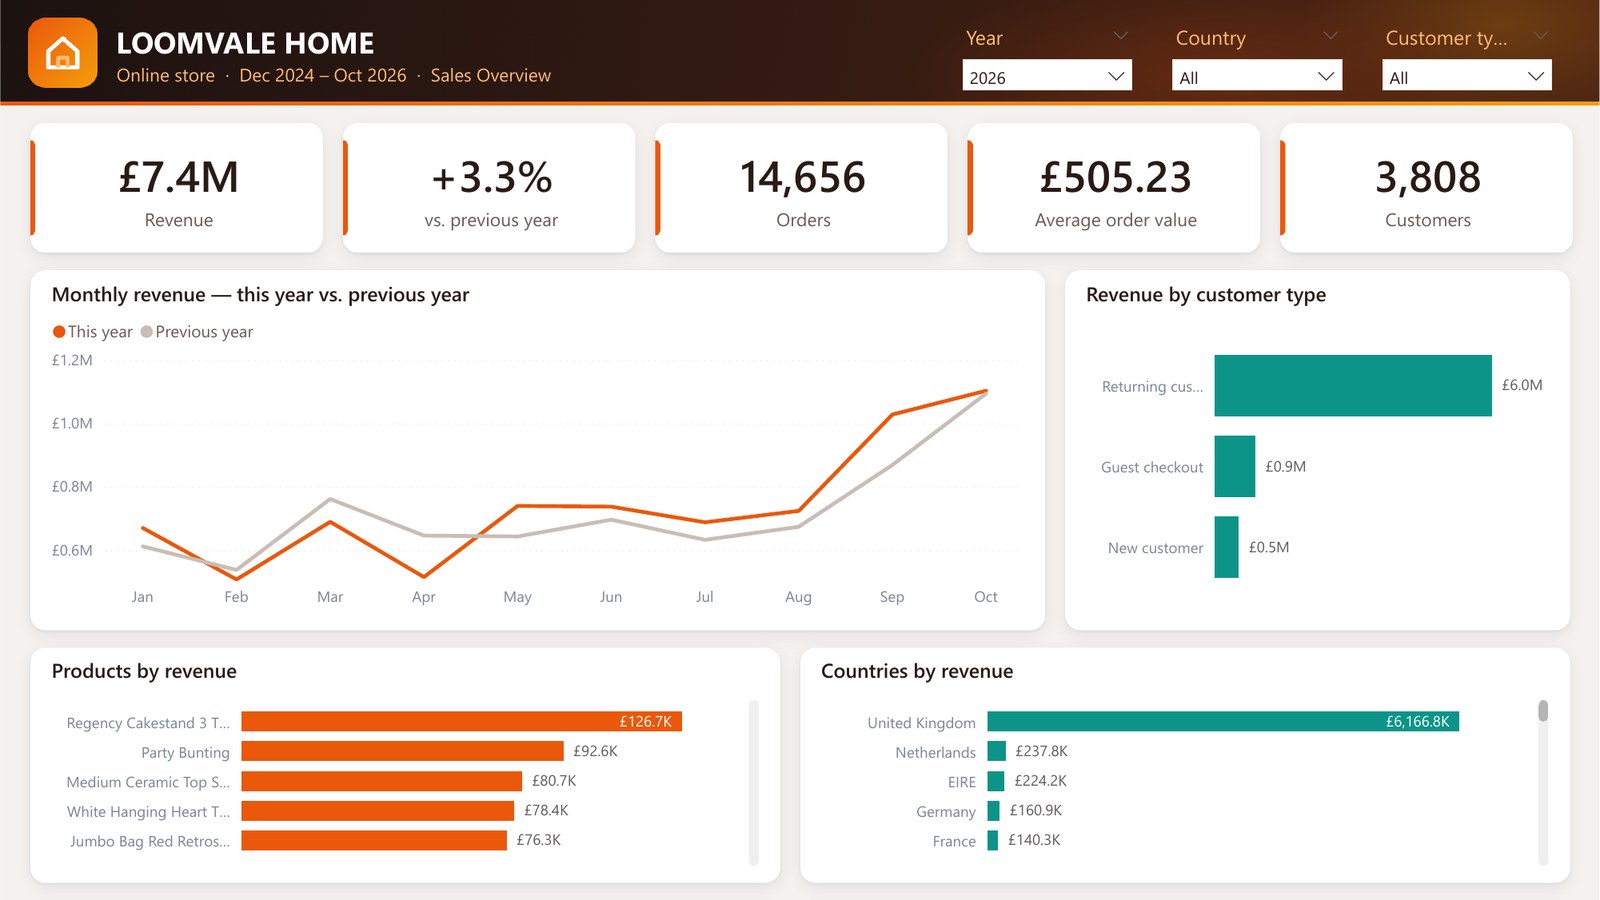
Are we growing, why, and which products and markets are moving the number?
Revenue is up 3.3% year to date even though orders are down 4.6%. The growth comes from baskets 8.2% bigger, so the next lever is getting more orders.
Cohort tables follow each month’s new customers. About one in five orders again the following month.
Variance tables rank the products and countries that gained or lost the most against last year.
Voyalto Store
Customer journey analysis in Power BI and Python
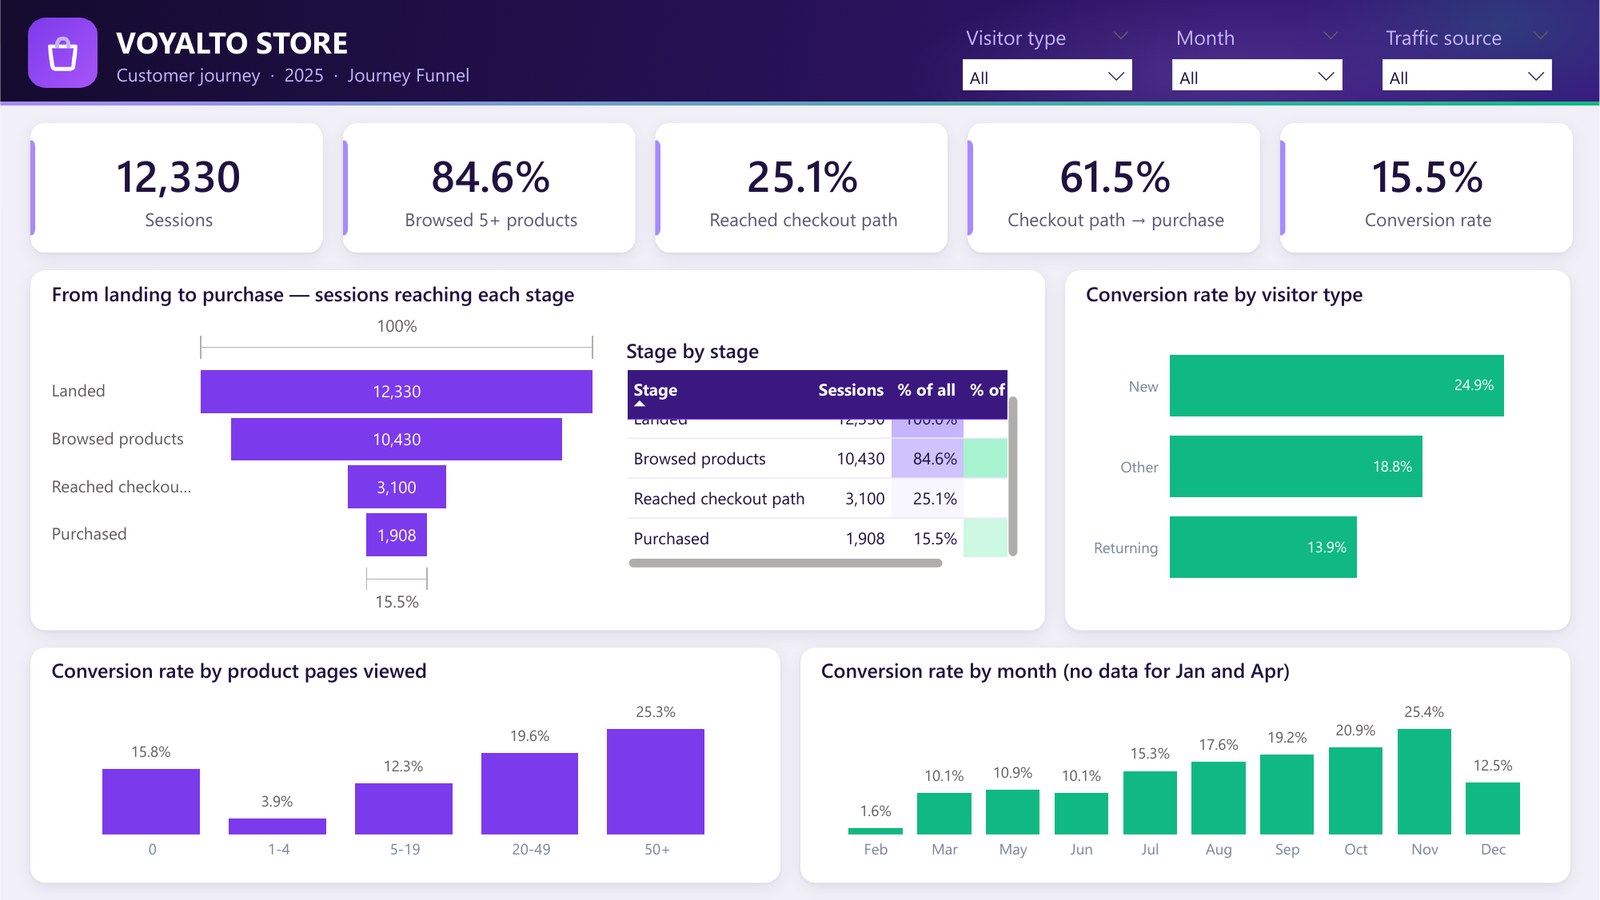
Where do visitors drop out on the way to a purchase, and what makes the ones who buy different?
85% of visitors browse at least five products, but only 30% of those reach the checkout path. That step is where most sales are lost.
A logistic regression shows that more time on product pages raises the odds of buying and a high exit rate lowers them. November visitors are more likely to buy than in any other month.
Each traffic source is compared with the average conversion rate, so you can see how many purchases it brings above or below what you’d expect.
From client work
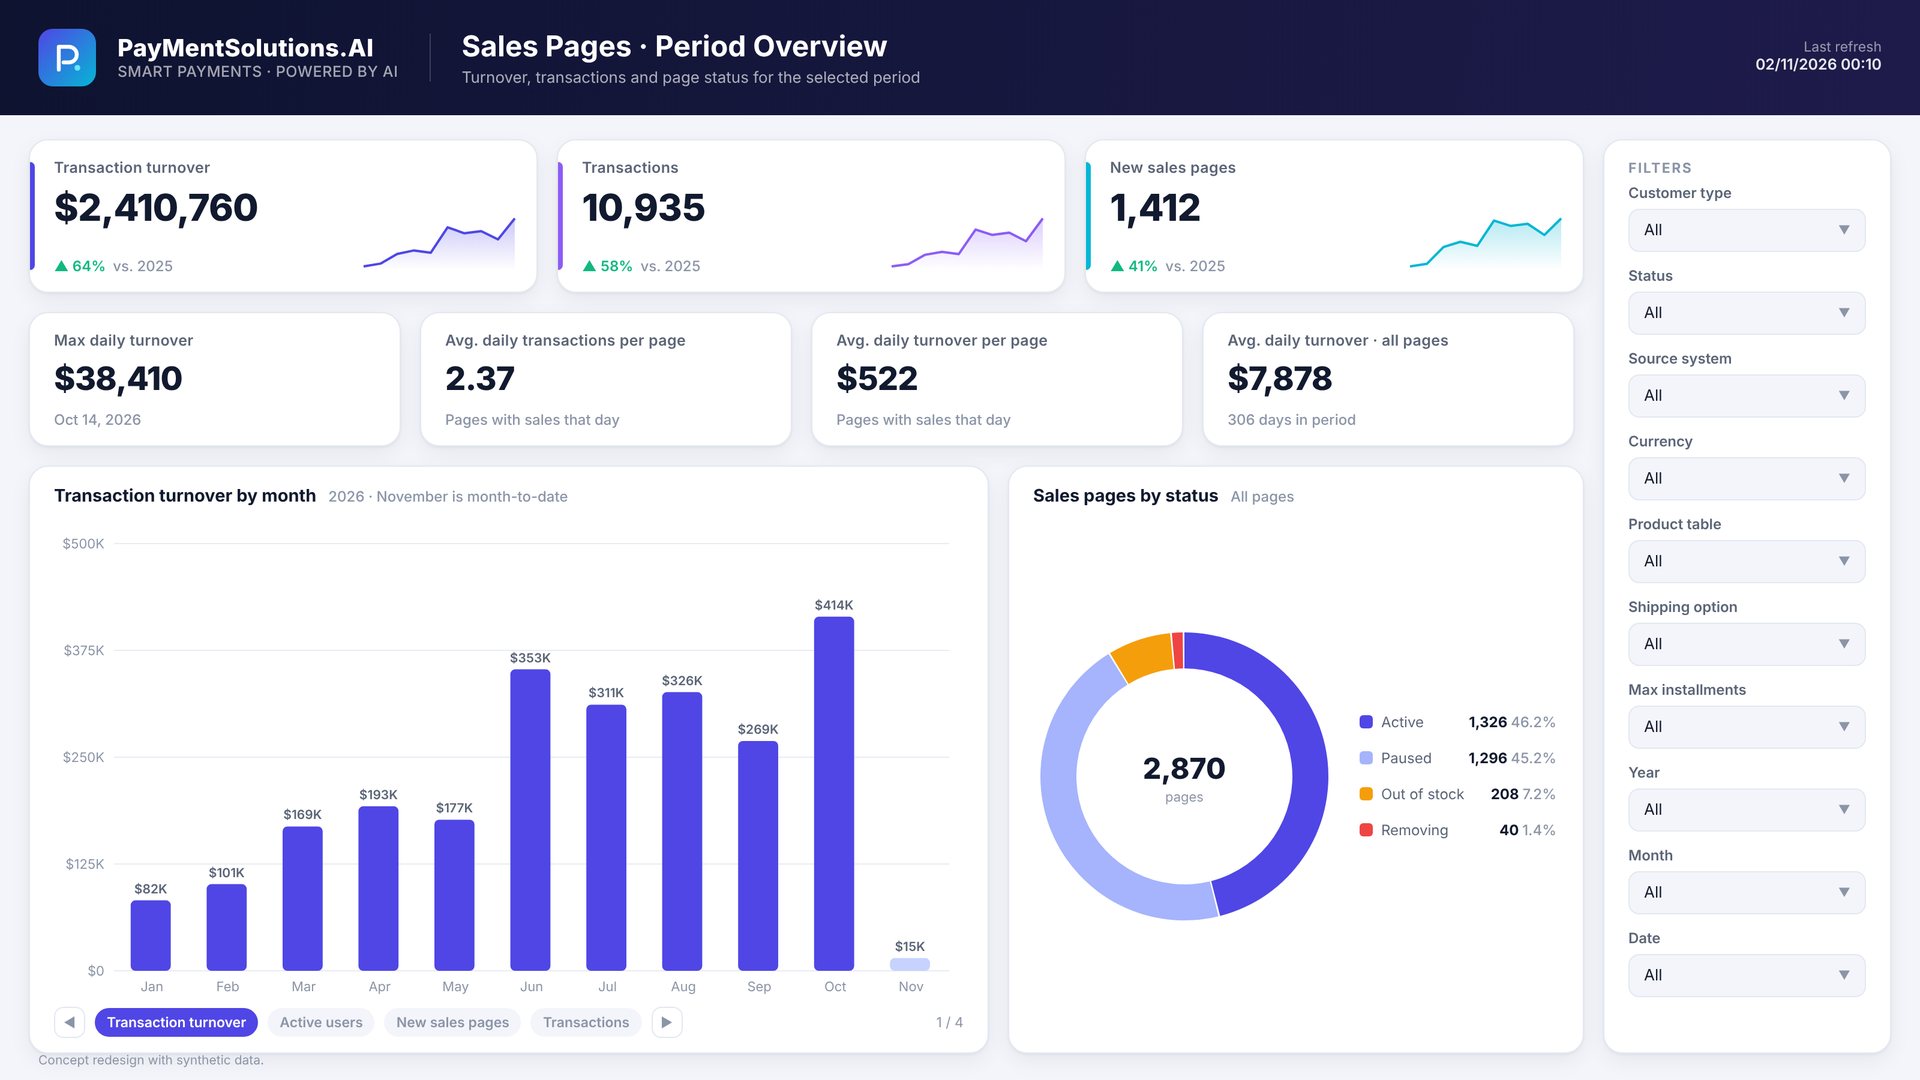
Payments dashboards in Power BI
Three dashboards I built in production for a payments company, redesigned and rebuilt with synthetic numbers.
A period overview of sales pages: turnover, transactions and daily averages for any period, with a monthly chart that switches between four metrics.
Payment links tracked against target by year and by month, across 23 months of requests.
A KPI view of sales pages: month to date, year to date and monthly averages for pages, merchants, transactions and turnover.
Want something like this on your data?
Tell me what you need to find out, and I’ll tell you what data it needs and what it would take.