Nice to meet you, I’m Nir Porat – Data & BI Developer and Consultant.
I help companies turn scattered data into answers they can act on. With an MBA and seven years of hands-on data work, I build the whole chain: pipelines that bring your sources together, Power BI and Looker dashboards people actually open, predictive models, and AI assistants that let your team ask the data questions in plain English.
Every project starts from a business question and ends with something your team can use the next morning.
Selected work
Each project starts from a business question and ends with a dashboard someone can act on.
How I can help
Four areas, one goal: turning your data into decisions that pay off.
Getting the data in one place, clean and trusted.
- “We don’t know where to start with our data.”
- A data strategy and architecture: which sources matter, which warehouse to use, and a step-by-step plan.
- “Our data sits in five different systems.”
- Pipelines that collect, clean and model the data on a schedule, so every report refreshes on its own.
- “Two reports show two different numbers.”
- Data quality checks, one definition for every KPI, and clear ownership and access rules.
- “We’ve outgrown Excel and our old server.”
- Migration to a cloud warehouse, or from one BI tool to another, without losing history or trust.
- “What are our competitors charging?”
- Automated collection of market and competitor data from the web, such as prices, offers and reviews, cleaned and ready for analysis.
Turning the data into answers people use.
- “We don’t have one view of the business.”
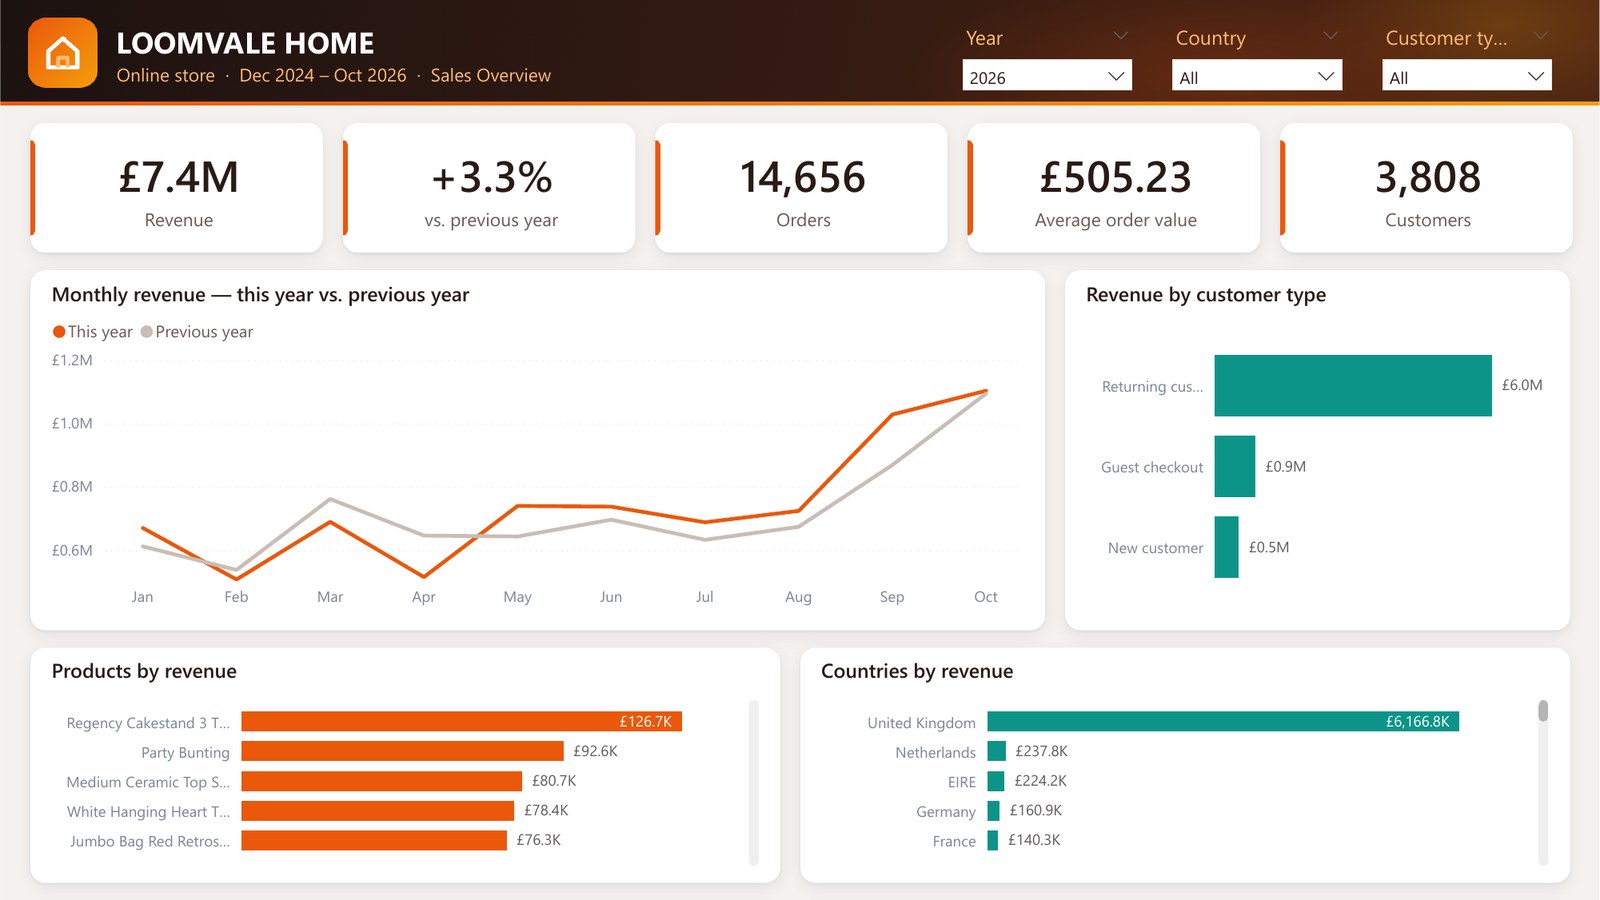
- Executive and operational dashboards on a clean data model, with self-service so teams can answer their own questions. See Loomvale Home
- “Is our marketing money working?”
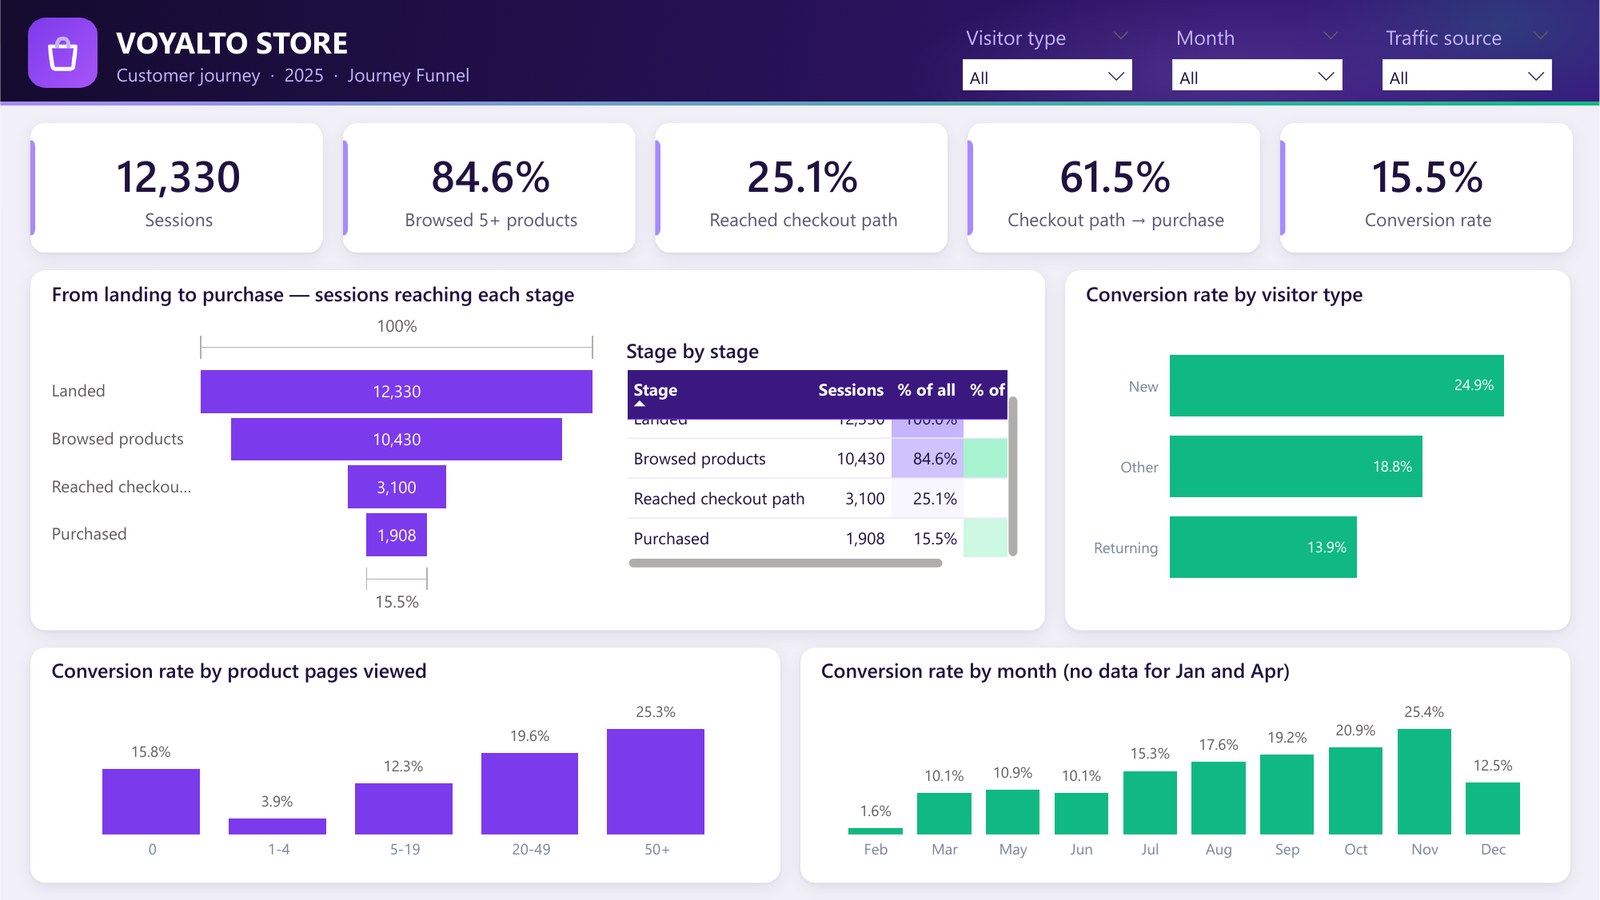
- Funnel, attribution and channel analysis with CAC, LTV and ROAS, so budget moves to what brings customers. See Voyalto Store
- “Which customers and products actually make us money?”
- Profitability by customer, product and channel, so effort and budget go where the margin is.
- “We don’t know how people actually use our product.”
- A tracking plan for what to measure, clean usage events and a dashboard that shows which features people use and where they get stuck.
- “Why are customers leaving?”
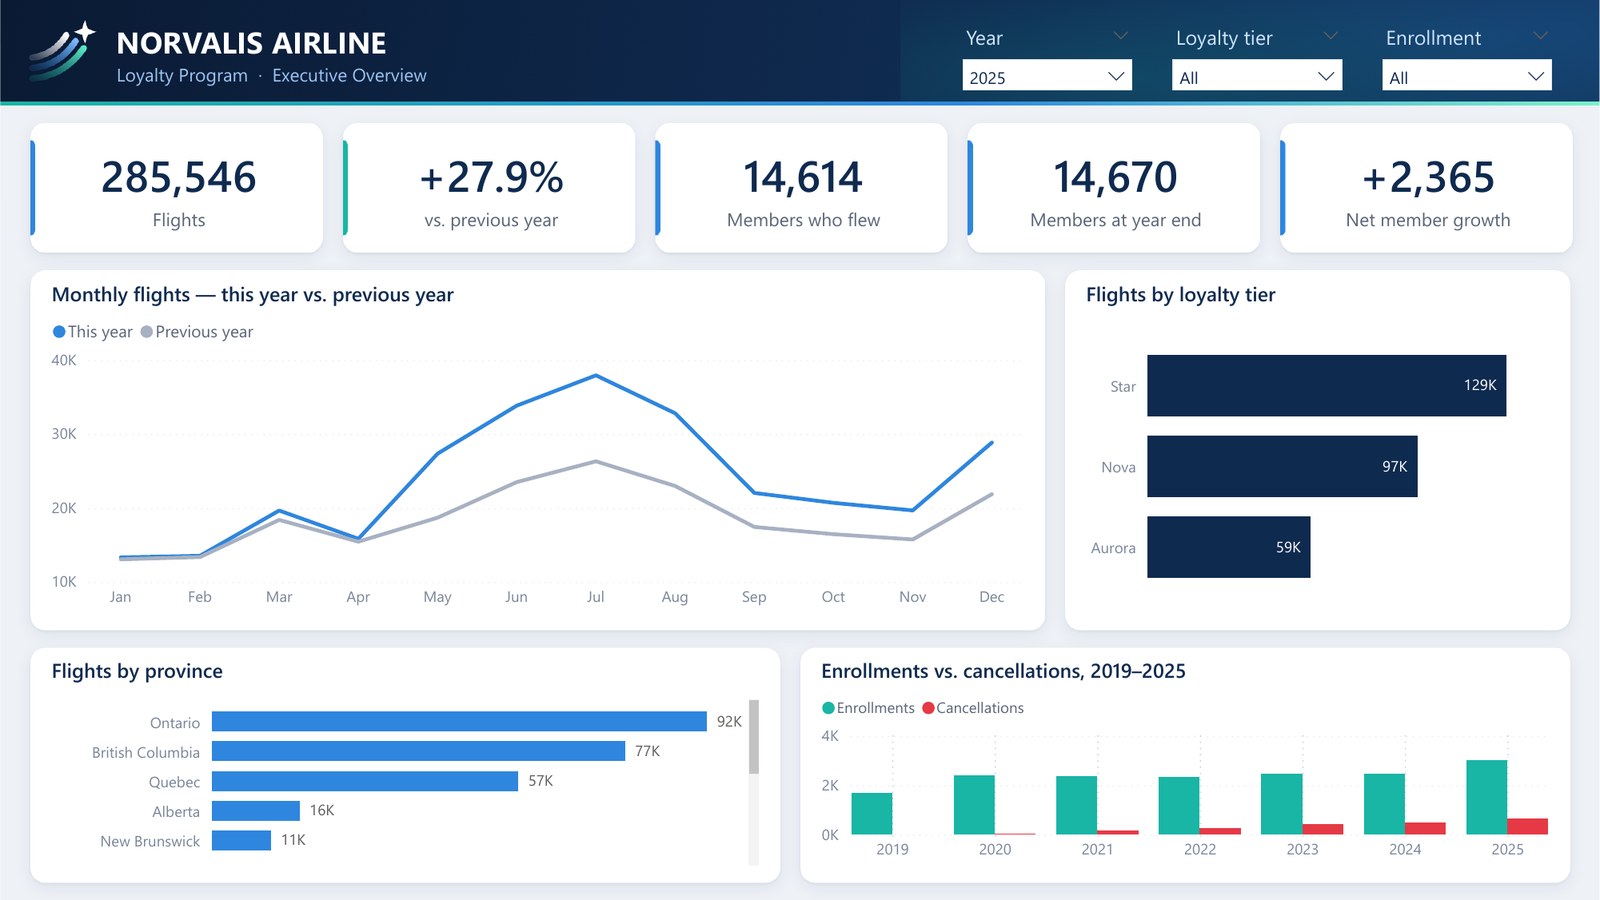
- Cohort, retention and churn analysis that connects customer behavior to revenue. See Norvalis Airline
- “Nobody trusts or opens our dashboards.”
- A review of your existing reports: speed, accuracy, design and what is actually used, with a list of fixes.
Seeing what is coming and measuring what works.
- “Can we see it coming?”
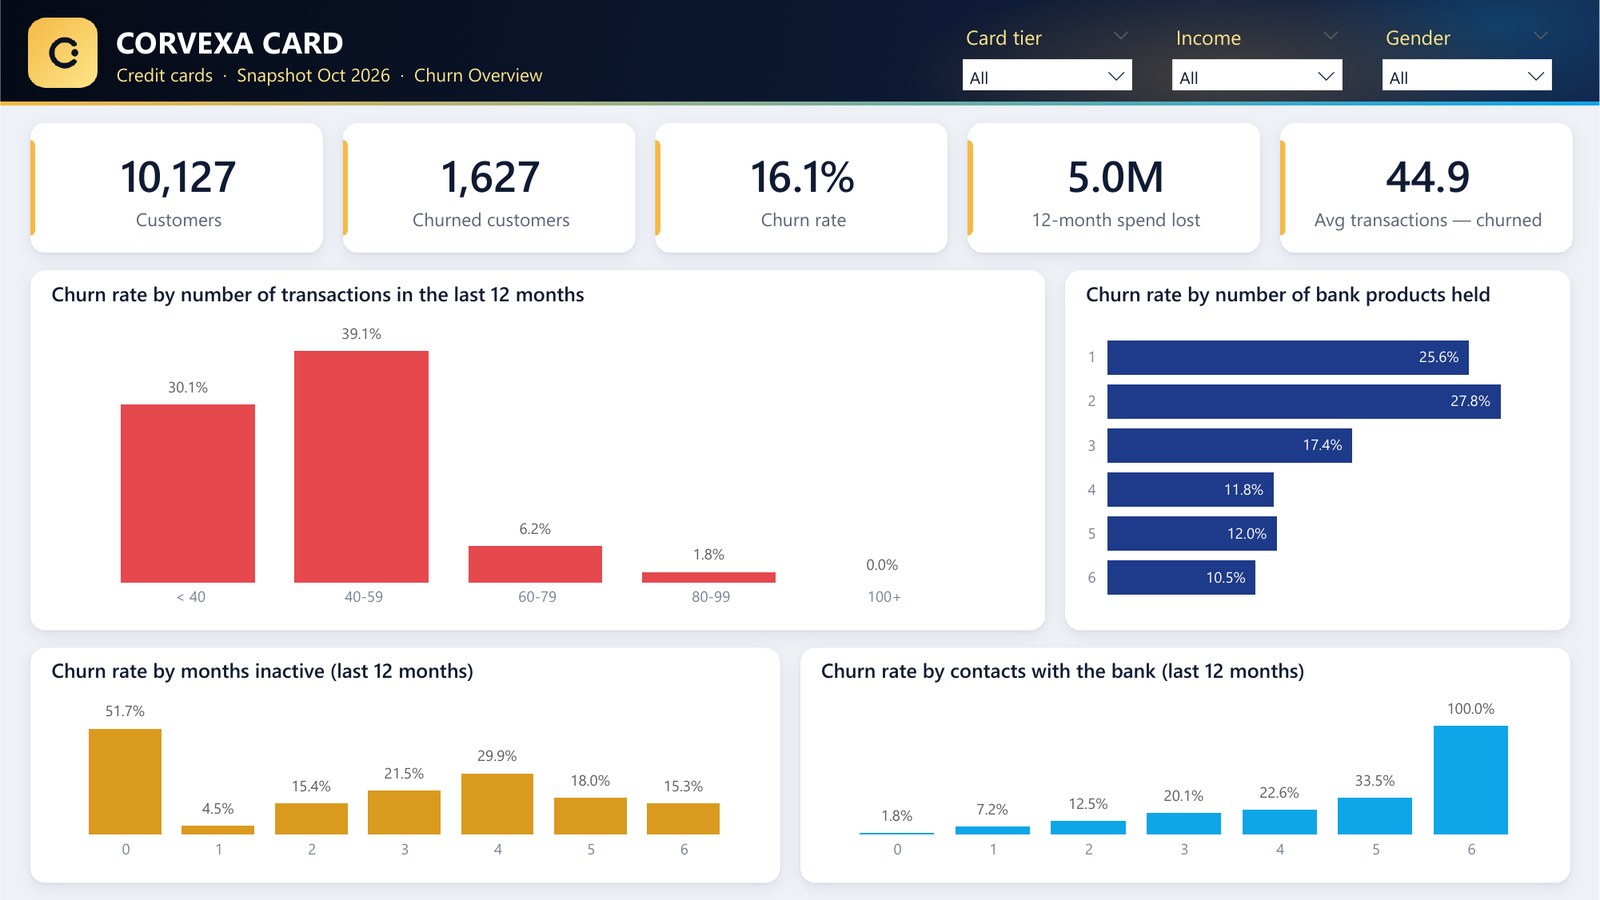
- Predictive models for churn, purchase propensity and demand, explained per customer and monitored once live. See Corvexa Card
- “We treat all our customers the same.”
- Customer segments built from behavior and value, so marketing, pricing and service can be tailored to each group.
- “Who should we approve, and at what limit?”
- Credit-risk models and approval policies for lending and cards, with ongoing monitoring of model performance.
- “Did the change actually work?”
- A/B tests and experiments designed properly: sample size, run time and a clear reading of the result.
- “Something doesn’t look right in the numbers.”
- Fraud and anomaly detection on transactions and operations, with alerts when patterns change.
Letting people ask the data directly.
- “I want to ask my data a question.”
- An AI assistant connected to your data model that answers in plain language, with every number traceable to a query. See Norvalis Airline
- “The same report takes someone a day every week.”
- Automated reporting: weekly summaries written for you and alerts sent to email or Slack when a KPI moves.
How a project runs
Discovery call
We talk about what you need to find out and the data you already have.
Assessment
I look at the sources and the current reports, and come back with a scoped plan and a price.
Build
I build in short steps and show working results every week or two, not just at the end.
Handover
Documentation, a walkthrough for your team, and everything stays in your own environment.
About me
I am a Data & BI Developer and Consultant with a strong background in bridging complex technical execution with business strategy. Holding an MBA specializing in Strategy & Entrepreneurship Management from The Hebrew University, I design data architectures not just as engineering pipelines, but as core drivers of operational efficiency and organizational growth.
Over my career, I’ve worked across fintech, SaaS, and the public sector—building and scaling end-to-end data systems that handle hundreds of millions of records. My expertise spans the complete data ecosystem:
- Data Architecture & Infrastructure: Architecting robust data platforms, designing Medallion architectures (Bronze, Silver, Gold), and building scalable ETL/ELT pipelines.
- GenAI & Conversational Analytics: Engineering custom AI agents integrated directly with enterprise datasets, enabling stakeholders to query complex data tables using natural language.
- Business Intelligence & Dashboards: Developing intuitive BI platforms and interactive executive dashboards (Power BI, Looker, QuickSight, Qlik Sense) that transform raw metrics into real-time operational clarity.
- Advanced Analytics & Pattern Discovery: Performing deep-dive data analysis to uncover hidden patterns, trends, and anomalies—translating complex numbers into clear, prioritized action items.
- Actionable Predictive Modeling: Building end-to-end Machine Learning pipelines and predictive models (such as churn prediction or risk scoring) that don’t just forecast future behavior, but directly drive proactive business interventions.
How We Can Work Together:
A great data solution is only as valuable as the decisions it enables. Whether you need a data platform built from the ground up, disconnected sources brought together, dashboards your managers will actually use, GenAI tools for your team, or in-depth analysis that turns your data into meaningful action, I work with organizations to transform fragmented data into a clear, dependable, and actionable advantage.
Skills
The tools and methods I use across the data value chain, from source systems to the final report.
BI and dashboards
Power BI (DAX, Power Query), Looker and LookML, Looker Studio, Tableau, Qlik Sense, Amazon QuickSight, Excel and Power Pivot, Python charts (Matplotlib, Seaborn, Plotly)
Data modeling
Dimensional modeling and star schemas, semantic layers, Medallion architecture (bronze, silver, gold), data warehousing, KPI definition, data governance and data quality
Data engineering
Advanced SQL (stored procedures, CTEs, window functions, performance tuning), Python, PySpark, dbt, Apache Airflow, SSIS, REST APIs, web scraping (BeautifulSoup, Selenium), Git, GitHub Actions, CI/CD, Docker
Cloud and warehouses
AWS (S3, Glue, Redshift, Athena, Lambda), Google Cloud (BigQuery, Vertex AI), Snowflake, SQL Server
Machine learning
scikit-learn, decision trees, random forests, gradient boosting (XGBoost, LightGBM), neural networks (TensorFlow, Keras), linear and logistic regression, clustering (k-means) and segmentation, time-series forecasting, NLP, churn and propensity models, credit-risk models and monitoring (Gini, KS, PSI), model explainability (SHAP)
Statistics and experimentation
A/B testing and experiment design, hypothesis testing, regression analysis, statsmodels, R, SAS, survey and market research
GenAI and data agents
LLM data agents on company data, text-to-SQL, MCP servers, Claude and Claude Code, Gemini, retrieval-augmented generation (RAG), prompt engineering
Analytics domains
E-commerce (conversion, basket size, repeat purchase), marketing (acquisition, attribution, CAC, LTV, ROAS, CPC), product and SaaS (funnels, cohorts, retention, churn, subscription revenue), fintech and payments, credit and risk, fraud and chargebacks, public sector and tourism
Working with the business
Gathering requirements with business teams, presenting findings to management and C-level, Agile and Scrum with Jira, mentoring analysts, Salesforce CRM data
Tell me the decision you’re trying to make.
I’ll tell you what data it needs, what it would take, and whether a dashboard, a pipeline or an analysis is the right first step.